Beginner Guides · 23 October 2026 · 10 min read
Total Expense Ratio (TER) Explained: What ETF Fees Really Cost You
The TER is the yearly running cost of a fund as a percentage of its assets. You do not pay it separately: it comes out of the fund every day and is already in the price, but it is not the only cost you pay.
By Marvin
The total expense ratio (TER) is the yearly running cost of a fund, shown as a percentage of the money in the fund. You do not pay it as a separate bill. The fund takes it bit by bit from its own assets, so it is already in the ETF's price and performance. On €10,000 in an ETF with a 0.20% TER, that is about €20 a year (a simplified figure, because the value of your holding moves every day).
That is the headline cost. It is not everything you pay. Trading inside the fund, your broker's fees and the spread when you buy or sell all come on top. This guide explains what the TER covers, how you pay it, what a few tenths of a percent cost over 30 years, and how to check the real cost of an ETF before you buy.
What the total expense ratio is
The TER tells you what it costs per year to run a fund. justETF describes it as "a percentage that indicates the annual running costs of an ETF". It is the number you see on a fund's product page and in its key information document (KIID or KID).
In Europe you will also see a second name: the ongoing charges figure (OCF). justETF calls the TER and the OCF "near-identical twins". They are not legally the same label, but they measure almost the same thing. The OCF has an official calculation method for all UCITS funds (UCITS is the EU rulebook for funds sold to ordinary investors). That method is guideline CESR/10-674, published on the website of ESMA, the EU markets authority. Its goal is to make funds easier to compare. In short, the guideline says:
- The OCF is the fund's total countable costs divided by its average net assets.
- Net assets are worked out from the fund's NAV (net asset value: what everything in the fund is worth, minus what it owes) each time the NAV is calculated, for example daily.
- The figure is shown as a percentage with two decimals, like 0.20%.
- It is calculated at least once a year, after the fact (ex-post), from audited accounts where possible. If something big changes, such as a fee increase, the fund may use an estimate instead.
- Each share class gets its own figure. A currency-hedged version of a fund can therefore have a different OCF than the unhedged one.
You will often hear fees in basis points (bps). One basis point is 0.01%. So 0.20% is 20 basis points, and the gap between 0.12% and 0.20% is 8 basis points.
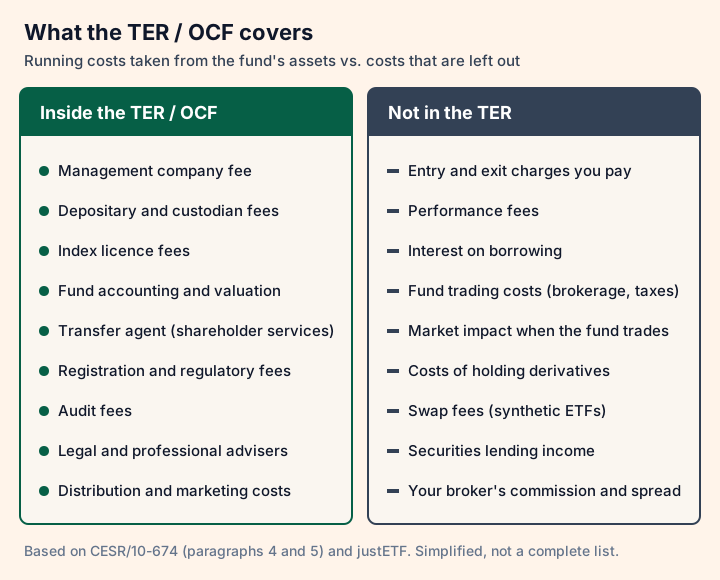 Diagram by Zero To Stocks. Simplified overview. Source: CESR/10-674 paragraphs 4 and 5; justETF, TER vs TCO.
What is inside the TER, and what is not
The CESR guideline starts from a simple rule: every cost the fund bears counts, unless it is explicitly excluded. Its list of what is normally included reads like the invoice pile of a fund:
- payments to the management company (the firm that runs the fund) and to any investment adviser;
- payments to the depositary and custodian, the bank that keeps the fund's shares safe;
- outsourced services, such as fund accounting, valuation and the transfer agent that keeps the shareholder register;
- registration and regulatory fees;
- audit fees;
- legal and professional advice;
- distribution costs.
justETF adds the index licence fee: the provider pays the index owner for the right to track the index. It also counts marketing and the cost of fund documents under distribution.
The guideline also lists what is not in the OCF:
- entry and exit charges that you pay directly;
- performance fees;
- interest on borrowing;
- the fund's own trading costs when it buys or sells assets, both visible ones (brokerage, taxes) and hidden ones (market impact, meaning the price moves against the fund because it trades);
- costs of holding derivatives, such as margin calls;
- goods or services a broker gives the fund manager in exchange for orders ("soft commissions").
justETF names three more things that sit outside the TER. Swap fees: a synthetic ETF gets the index return through a contract with a bank, called a swap, and pays fees for it. Securities lending income: a fund can lend some of its shares to other market players for a fee, which brings money in. And fund-level transaction costs when the ETF adjusts its portfolio to the index.
These costs and income are outside the TER, but they still happen inside the fund. They change the fund's performance, so you feel them even though the TER does not show them.
A detail that is easy to miss: if the management company earns part of the fund's stock-lending income through a fee-sharing deal, the CESR guideline says that payment must be added to the OCF.
How and when you pay it
You pay the TER every day you own the ETF, in very small slices. justETF puts it this way: the cost is "deducted pro-rata from your holdings on a daily basis". On every fund profile it adds that these costs are "withdrawn continuously from the fund assets and already included in the performance of the ETF. You don't have to pay them separately."
In practice this means:
- No bill, no line on your statement. The fee is already included in the fund's performance, so the price you see is already net of it.
- You pay only while you hold. Buy on Monday and sell on Friday, and you carry only a few days' worth of the yearly fee.
- The rate is set per share class, not per investor. When Vanguard announced its July 2026 fee cut, it said the cut applies to all investors, including those who already own the ETF, not only to new buyers (more on that below).
So the answer to "when do you pay the expense ratio?" is: continuously, as long as you own the fund, through a slightly lower price than the fund would otherwise have.
What a small difference costs over 30 years
A fee of a few tenths of a percent sounds tiny. Over decades it is not, because the money taken out each year also stops growing.
Here is our own illustration. It is a simplified example, not a forecast or a return expectation. €10,000 is invested once. The investments earn 7% a year before costs. We hold for 30 years. The end value is 10,000 × (1 + 0.07 − TER)^30. The 0.50% and 1.00% rows are round example values, not real funds.
| TER | Cost in year one (simplified) | Value after 30 years | Less than with 0% |
|---|---|---|---|
| 0% | €0 | €76,123 | — |
| 0.12% | €12 | €73,603 | €2,520 |
| 0.14% | €14 | €73,191 | €2,932 |
| 0.20% | €20 | €71,968 | €4,155 |
| 0.50% | — | €66,144 | €9,979 |
| 1.00% | — | €57,435 | €18,688 |
A year-one cost of €12 or €20 does not feel like much. After 30 years, the gap between a 0.12% and a 0.20% fund in this example is about €1,640. At 1%, nearly a quarter of the no-cost result is gone.
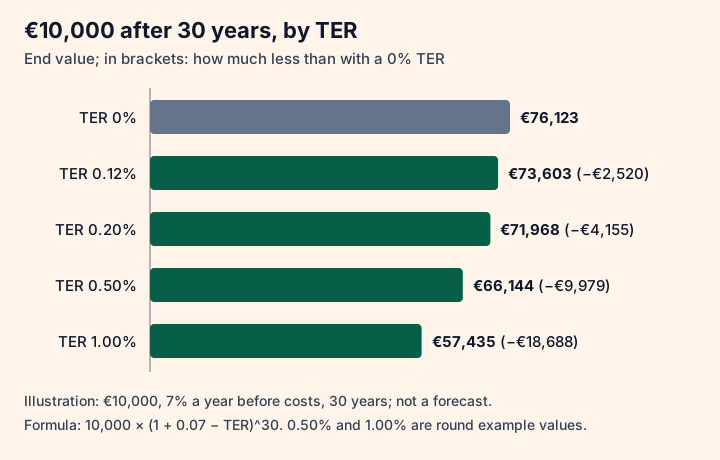 Diagram by Zero To Stocks. Illustration: €10,000, 7% a year before costs, 30 years; not a forecast. Source: own calculation.
For a fund-by-fund version of this maths with two real MSCI World ETFs, see the 0.12% vs 0.20% comparison in our SWRD review.
Real UCITS examples: 0.12% to 0.20%
Three large world-index ETFs that many European investors look at, with their TER as listed on justETF on October 23, 2026:
| ETF | ISIN | TER | Source |
|---|---|---|---|
| State Street SPDR MSCI World UCITS ETF USD Unhedged (Acc), "SWRD" | IE00BFY0GT14 | 0.12% | justETF, Oct 23, 2026 |
| Vanguard FTSE All-World UCITS ETF (USD) Acc, "VWCE" | IE00BK5BQT80 | 0.14% | justETF, Oct 23, 2026 |
| iShares Core MSCI World UCITS ETF USD (Acc), "IWDA" | IE00B4L5Y983 | 0.20% | justETF, Oct 23, 2026 |
justETF lists all three as physical ETFs using optimised sampling: they buy a selection of the most relevant index shares instead of every single one. Two of them track the same index (MSCI World) at different prices. Our IWDA review covers the 0.20% fund in detail.
TERs change. On 21 July 2026 Vanguard announced that from 28 July 2026 the OCF of the Vanguard FTSE All-World UCITS ETF would drop from 0.19% to 0.14% of NAV for the unhedged share classes, and from 0.22% to 0.17% for the hedged ones. Vanguard Germany called it a cut of about a quarter and said it applies to all investors, whether they buy the ETF new or already own it. Our VWCE review covers the fund itself. For the fee, always check the current fund page.
justETF makes a related point: a recent fee cut barely shows up in long-term historical returns, but it does affect future returns. A fund that just became cheaper can look more expensive in past data than it is today.
Why the TER is not your total cost
justETF is blunt about it: "The TER does not include all ETF costs," and "ETFs with a lower TER do not necessarily outperform ETFs with a higher TER." To see what the fund really cost you, look at the tracking difference.
Tracking difference is the gap between the ETF's return and the return of the index it follows. In this guide we use Morningstar's definition: ETF return minus index return. justETF's example: the index returns 10% and the ETF returns 9%. The tracking difference is then −1 percentage point, because the ETF trailed its index by 1 point. Morningstar gives a similar example. If an ETF charges a hypothetical 0.25% and the index rises 10%, you would expect about 9.75%, all else being equal.
The tracking difference can also be positive. That means the ETF beat its index. justETF lists three reasons an ETF can beat its index for a while:
- it earns extra income from securities lending;
- it pays less tax on dividends than the index calculation assumes;
- its holdings differ slightly from the index, and that works out well for a period.
Morningstar splits the total cost of owning an ETF into two parts: holding costs and transaction costs. Holding costs are the fee plus hidden costs that show up as tracking difference. Examples are sampling (not holding every index share), index turnover (the fund must trade when companies go bankrupt or merge) and foreign withholding taxes on dividends that cannot always be reclaimed. Transaction costs are commissions, bid-ask spreads and market impact. For long-term investors, Morningstar says holding costs are usually the biggest part. Over long periods the total cost often ends up close to the expense ratio. For short holding periods and large trades, transaction costs matter more.
Do not confuse tracking difference with tracking error. Morningstar explains that tracking difference is the return gap over a period. Tracking error measures how much that gap jumps around over time.
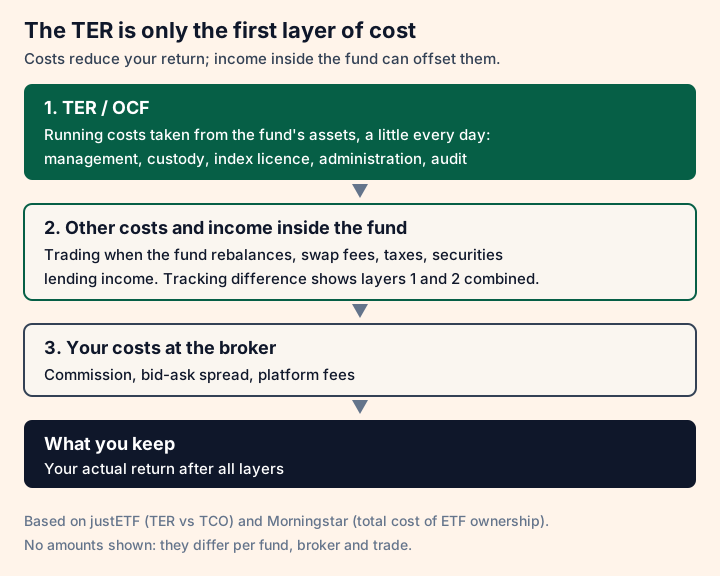 Diagram by Zero To Stocks. Simplified, no amounts. Costs reduce your return; income inside the fund can offset them. Source: justETF, TER vs TCO; Morningstar, total cost of ETF ownership.
How to use this: justETF suggests comparing an ETF with its index over a longer period and ignoring anything shorter than one year. If good index data is hard to find, compare several ETFs that track the same index. The one with the highest return over several periods usually has the lowest total cost. Keep in mind that this only tells you about the past.
Costs you pay outside the fund
On top of everything inside the fund come costs that you pay yourself when you trade. justETF calls these external costs, and they are easier to see.
- Broker commission. Morningstar calls it the most visible trading cost. Many ETFs can be traded without commission, depending on the ETF and the broker.
- Bid-ask spread. This is the gap between the price a market maker will pay you for a share (bid) and the price at which it will sell you one (ask). You pay it every time you buy or sell. justETF compares it to changing money for a holiday: the rate to buy and the rate to sell differ. Morningstar adds that spreads differ per fund and get wider when markets are nervous.
- Market impact. A large order in a less liquid ETF can push the price against you. For small, regular purchases this matters little.
- Platform charges. Some brokers charge a fee for holding your account or for savings plans. Your broker must tell you these fees.
The TER has nothing to do with these costs, as justETF points out: it does not include what you pay the broker for placing orders or running a savings plan. Broker fees change often, so we keep them in our broker guides: Trading 212 vs DEGIRO and our Interactive Brokers review.
Is a 0.3% or 1% TER bad?
There is no official line between a "good" and a "bad" TER. A fair way to judge one is to compare it with funds that do the same job.
Is 0.3% a good expense ratio? For a broad world-index ETF it is on the high side next to the examples above, which charge 0.12% to 0.20%. On €10,000 that is about €30 a year instead of €12 to €20. That is not a disaster, but you should know what the extra money pays for.
What does a 0.75% expense ratio mean? It means the fund takes €0.75 of every €100 you hold each year. On €10,000 that is about €75 a year, before any trading costs.
Is a 1% expense ratio bad? For a simple broad index fund, 1% would be far above the examples here, five times the 0.20% of IWDA. In our illustration it costs €18,688 over 30 years compared with no fee, against €4,155 at 0.20%. For a fund that does something different, such as tracking a narrow niche index or being actively managed, a higher fee can be part of the deal. The question then is whether that difference is worth the cost to you.
Two more points keep this in proportion. A lower TER does not guarantee a better result (justETF). And a small TER gap between two similar funds can be wiped out by a wider spread or a commission at your broker.
How to check an ETF's real cost before you buy
- Find the current TER or OCF on the provider's product page or in the KID, not only on a blog or forum post.
- Check when it last changed. A recent cut, like Vanguard's in July 2026, may not be on older pages or in past returns yet.
- Look at the tracking difference over at least one year, against the index or against other ETFs that track the same index.
- Check how the fund replicates the index. Physical (it holds the shares, fully or by sampling) or synthetic (it uses a swap). Swap fees are not in the TER.
- Check the bid-ask spread on the exchange your broker uses, at the time you usually trade.
- Add up your broker costs: commission and platform fees.
- Do not switch funds to save a few basis points before you count the cost of selling, buying and crossing the spread twice.
If you are just getting started, our guide to investing in ETFs as a European walks through the broker and first-purchase steps. For a wider view of common starter funds, see best UCITS ETFs for beginners.
Limits of this guide
This guide explains costs. It is not financial advice and not a recommendation to buy any fund. The 30-year example is a simplified illustration with an assumed 7% return before costs. Real returns go up and down, and fees are charged on a balance that changes every day. TERs change too, so check the fund's own page before you act. Sources checked October 23, 2026.
Sources
- CESR/10-674 — Guidelines on the methodology for calculation of the ongoing charges figure in the KIID (ESMA)
- justETF — Cost of ETFs: Total Expense Ratio (TER) vs. Total Cost of Ownership (TCO)
- justETF — iShares Core MSCI World UCITS ETF USD (Acc), IE00B4L5Y983
- justETF — Vanguard FTSE All-World UCITS ETF (USD) Accumulating, IE00BK5BQT80
- justETF — State Street SPDR MSCI World UCITS ETF USD Unhedged (Acc), IE00BFY0GT14
- Vanguard Funds plc — Notification of Fee Reduction, RNS 21 July 2026 (via shareprices.com)
- Vanguard Germany — Wir senken unsere Gebühren für einen unserer beliebtesten ETFs
- Morningstar — Calculating the Total Cost of ETF Ownership
FAQ
What is a total expense ratio?
The total expense ratio (TER) is the yearly running cost of a fund, shown as a percentage of the fund's assets. It covers costs such as the management fee, custody, index licence, administration and audit. A TER of 0.20% means about €20 a year on €10,000 (a simplified figure).
Do I pay the TER separately?
No. The fund takes the TER from its own assets a little every day, so it is already included in the ETF's price and performance. You do not get a separate bill. Broker commissions and the bid-ask spread are separate costs that you do pay on top.
Is TER the same as OCF?
They are very close. justETF calls them near-identical twins. The ongoing charges figure (OCF) has an official EU calculation method (CESR/10-674): total costs divided by the fund's average net assets, shown to two decimals and worked out at least once a year for each share class. Product pages and the KIID quote one or the other.
What is a good total expense ratio for an ETF?
There is no official cut-off. A useful approach is to compare like with like. On October 23, 2026, justETF listed three large world-index UCITS ETFs at 0.12%, 0.14% and 0.20%. A fund that tracks a similar broad index for much more should have a clear reason for it. Also check tracking difference and your own trading costs.
Is a 1% expense ratio bad?
Not automatically, but it is expensive next to broad index ETFs that charge 0.12% to 0.20%. In a simplified illustration (€10,000, 7% a year before costs, 30 years) a 1% TER leaves about €57,435, against €71,968 at 0.20% and €76,123 with no costs. Whether 1% is worth it depends on what the fund does for you.
Continue reading